FAQ - Why Should We Care?
Click the question to show the answer. Click again to close.
What are the expected impacts of declining salinity in the North Atlantic?
Scientists have been concerned that meltwater from Greenland could decrease the salinity of North Atlantic seawater enough to shut off the thermohaline circulation system that warms Europe and powers the Gulf Stream. However, the latest studies indicate that this is probably not as great of a threat as was once feared, at least in this century.
What is the concern about a "tipping point?"
Change does not always happen gradually. Tipping points are large, sudden-onset, long-term consequences that result from an apparently small change. An example would be tilting a table until the items on top suddenly slide off. Climate scientists are concerned that the gradual increase of carbon dioxide may trigger tipping points in natural systems that will be dangerous, expensive, and may be impossible to reverse in the short-term. These kinds of tipping points include the dieback of the Amazon rainforest and the melting of the Greenland ice sheet. These changes could trigger other consequences that might include:
• Collapse of the Indian Summer Monsoon
• Dieback of the boreal conifer forest
• The greening of the Sahara/Sahel in Africa (an unusual example of a beneficial potential tipping element)
Does a hard winter in a particular location prove global warming isn’t true?
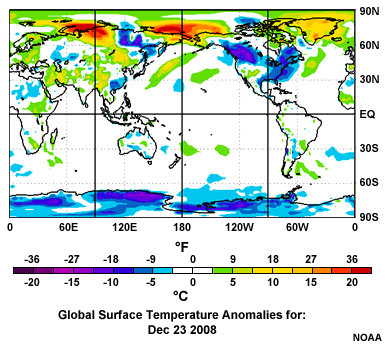
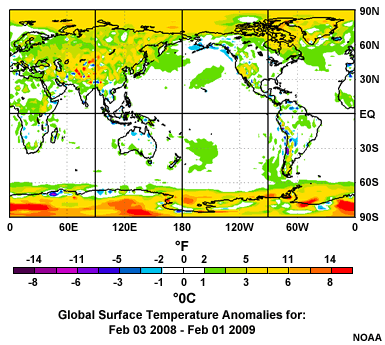
No. Climate change is superimposed on underlying natural variability. There have always been cold snaps and heat waves, and they will continue within the context of higher overall temperatures. The global average temperature may be cooler from one year to the next due to this natural variability. Other natural indicators such as sea-level rise and glacier loss tell us that long-term change is unfolding even in months or years that seem relatively cool. What’s most important is the pattern we see over large areas and long time periods, not what’s happening in a particular place on a particular day. For example, compare these two graphics:

Tuesday, Dec. 23, 2008: Notice the cold snap in the eastern third of the U.S. and western Canada.

Annual Anomalies (Feb. 2008-Feb. 2009): The larger warming trend becomes apparent in the annual data.